Introduction
Variable visualiser is an app designed to teach people who are new to C/C++ about variables and memory allocation. It allows the user to type in C++ code and see a visual representation of that code's affect on RAM.
RAM Panel
On the left is the RAM Panel which displays a simulation of a computer's RAM, divided into Heap, Static, and Stack sections.
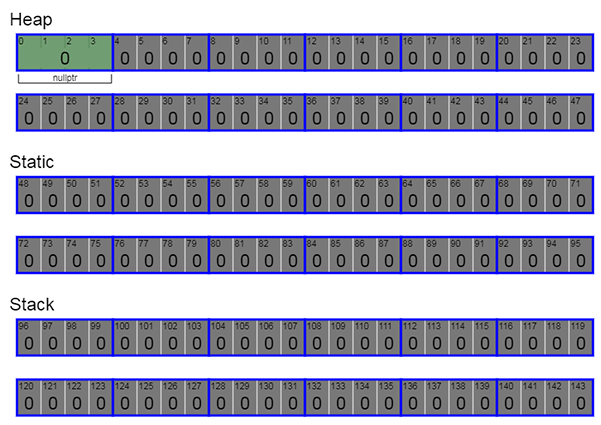
Each of these section is in turn divided into bytes and each of these displays it's value and address in memory. Bytes are arranged in groups of four to represent the word size of a 32-bit machine.
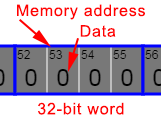
The bytes are displayed in different colours to indicate their state, and when multiple bytes contribute to form one variable only their combined value is displayed.

Code Panel
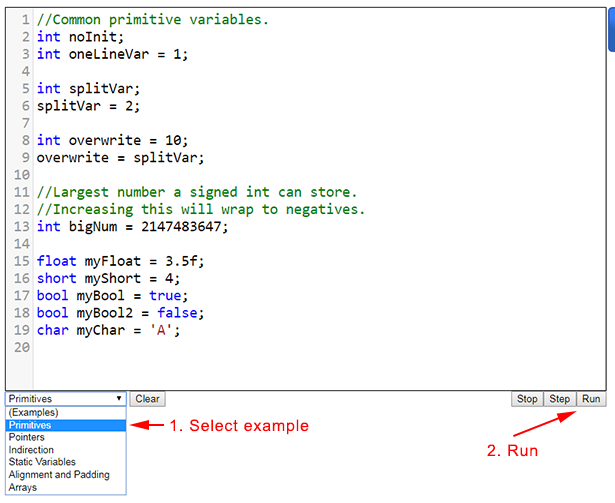
To the right is the Code Panel where the user can type in C++ code or chose from one of several premade examples. To begin, try choosing from some of the premade examples and click Run to see the result, or repeatedly click Step to see the code processed one line at a time.
Watch Panel
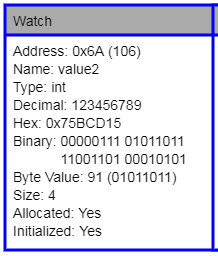
The watch panel displays additional information about the byte or variable currently under the mouse:
- Address: The memory address of the byte in hex with decimal displayed in parentheses.
- Name: The name of the variable. If the byte is not part of a variable, or its name is unknown then "???" is displayed.
- Type: The type of the variable, or "???" if the byte is not part of a variable.
- Value: The value of the variable as a decimal or floating point number. For characters, the ASCII value is displayed.
- Hex: The value in hexadecimal.
- Binary: The value in binary (Little Endian).
- Byte Value: The value of the individual byte. The binary value is also shown in parentheses.
- Size: The size of the variable in bytes.
- Allocated: Has the byte been allocated as part of a variable?
- Initialised: Has the variable been given a value? If no, then the byte will be filled with either a specific value to indicate it is uninitialized or garbage (depending on settings).
Console Panel
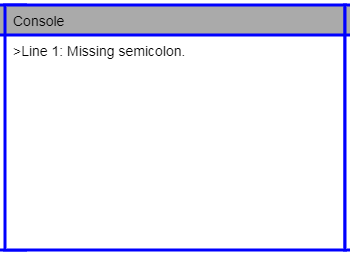
The Console displays error messages if invalid C++ code is entered into the Code Window. I tried to make these errors helpful, but in some cases an inaccurate error, or even no error may be displayed. See the Verbose Logging option for other ways to check for errors.
Settings Panel
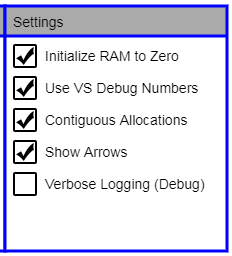
The Settings Panel contains options that can be toggled to change the way the app works.
- Initialise RAM to Zero (default On): If turned on unallocated RAM will be set to zero, emulating the behaviour of many IDEs operating in debug mode. When turned off, the RAM will begin with random garbage values which more accurately reflects the state of RAM likely to be encountered when a non-debug program runs.
- Use VS Debug Numbers (default On): Turns on the "magic numbers" used in Visual Studio to indicate the state of some uninitialized variables. The following magic numbers are supported:
- 0xCCCCCCCC: Memory has been allocated on the Stack but it has not been initialised.
- 0xCDCDCDCD: Memory has been allocated on the Heap but it has not been initialised.
- 0xDDDDDDDD: Memory on the Heap has been deleted.
- Contiguous Allocations (default On): When this option is enabled, all allocations will be contiguous in memory and padded to keep them aligned the way they would be within a struct or class. When disabled the variables will be allocated from an unpredictable area of RAM which is how individual Stack and Heap allocations usually work.
- Show Arrows (default On): Enables the arrows that are displayed connecting pointers to their pointees which can be helpful for visualising their relationship.
- Verbose Logging (default Off): When enabled, the app will print extra debugging information to the browser's developer console. This can sometimes be helpful when trying to work out why your C++ code isn't working if the Console hasn't provided enough information. Then again it may not be helpful at all.